Graph Topology and Visualization
Data Model
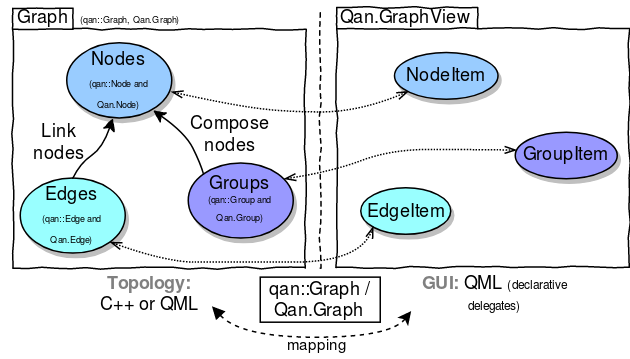
QuickQanava data model enforce a clear separation between description of topology and it's visual representation:
- Topology is defined from C++ or QML (with imperative Js) using the
qan::Graphinterface. - Topology primitives returned by
createX()orinsertX()have a visual counterpart available trough theirgetItem()method oritemproperty.
To keep data-model simple and efficient, topology is defined in a imperative way in C++ code or in a QML Component.onCompleted() handler. Visual representation of graph topology is then managed from a view, usually in pure QML with Qan.GraphView component. The unique proxy for editing topology is qan::Graph class and it's QML interface Qan.Graph.
Graph topology is internally modeled using adjacency lists, these lists are exposed to QML and C++ with Qt abstract item models: a change in topology trigger a signal or a virtual method call in behavior observers. For example, any view connected to a node outNodes model is automatically updated when a directed edge is inserted from that node to another one.
QuickQanava Initialization
QuickQanava should be initialized in your c++ main function:
#include <QuickQanava>

int main(int argc, char *argv[])
{
    QGuiApplication app(argc, argv);
    QQuickStyle::setStyle("Material");
    QQmlApplicationEngine engine;
    // Or in a custom QQuickView constructor:
    QuickQanava::initialize();
    engine.load( ... );
    return app.exec();
}
Then, in QML import QuickQanava:
And create a Qan.Graph component to build a simple directed graph:
Qan.Graph {
id: graph
anchors.fill: parent
Component.onCompleted: {
var n1 = graph.insertNode()
n1.label = "Hello World"
}
}
Graph View
A Qan.Graph or qan::Graph is a graphic item, but it is mainly used to define graph topology and should be embedded in a "graph view", following a (loose) MVC pattern to enable complete user interaction with the graph. A graph is binded to a view trough the Qan.GraphView.graph property:
Qan.GraphView {
id: graphView
anchors.fill: parent
navigable : true
graph: Qan.Graph {
id: topology
} // Qan.Graph: topology
} // Qan.GraphView
Binding a Qan.Graph component to graph property of a Qan.GraphView item allow navigation using mouse panning and zooming, navigation could be disabled by setting the QanGraph.navigable property to false (it default to true).
There is more options for customizing how the view is rendered:
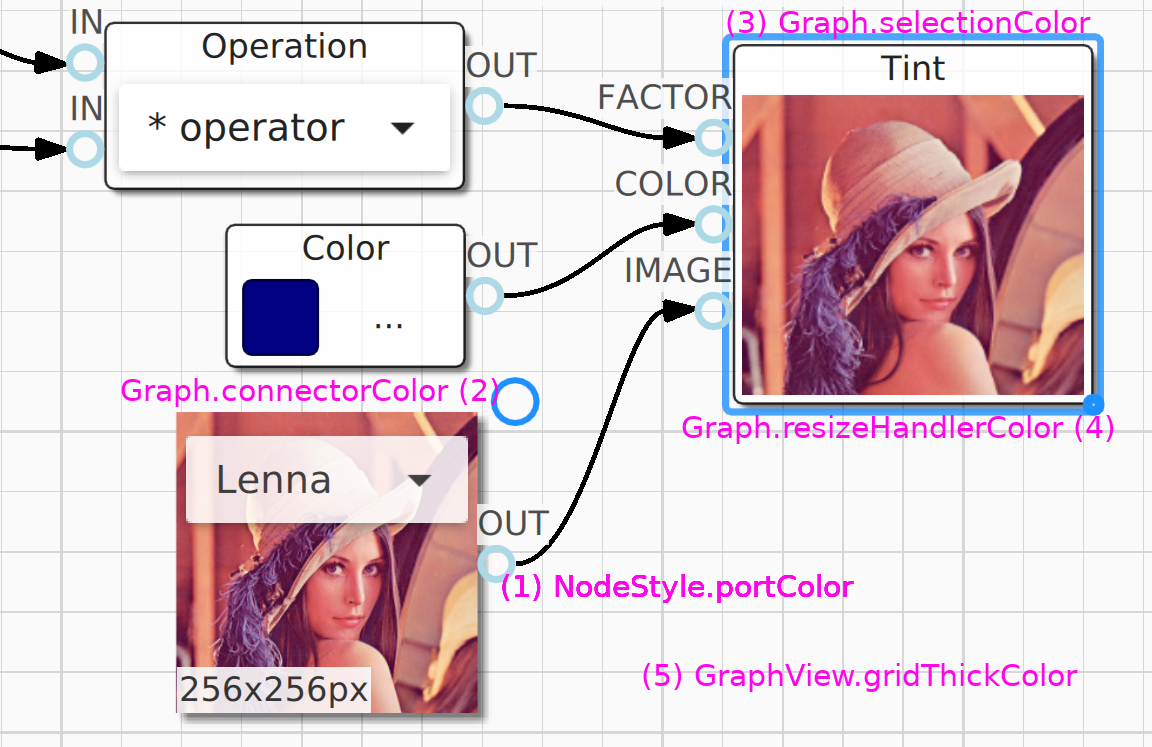
Qan.Graph.connectorColor: Visual edge creation tool 'handler' color (default to dodgerblue).Qan.Graph.selectionColor: Selection rect color (available for nodes and groups).Qan.GraphView.resizeHandlerColor: Bottom right corner resize handler color.Qan.GraphView.resizeHandlerOpacity,resizeHandlerRadius,resizeHandlerWidthandresizeHandlerSize: More options for bottom right corner resize handler configuration.Qan.GraphView.gridThickColor: Grid major thick color (works for both point and line grids).
For a more detailed description, see Material Styling
Grid
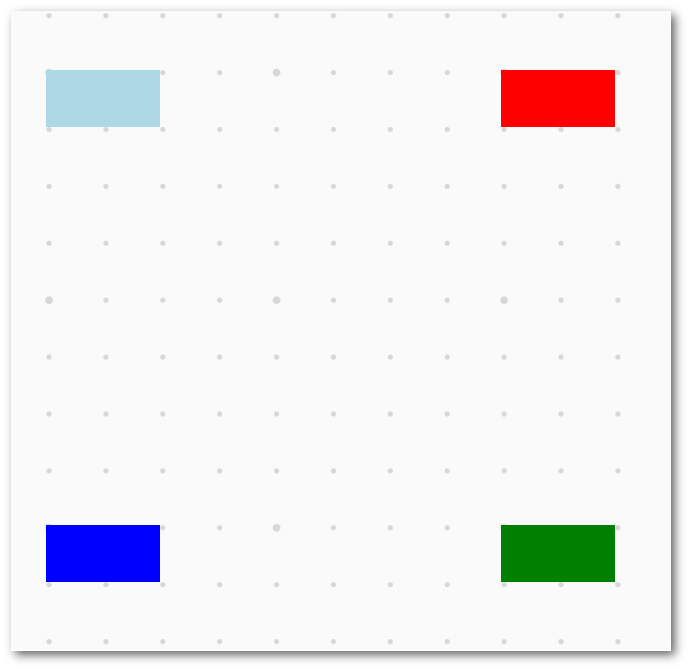
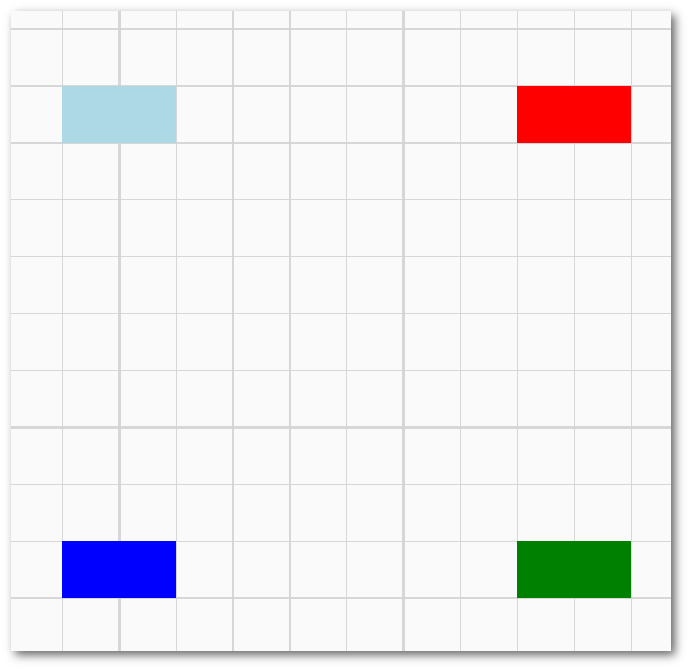
Grid could be configured with Qan.GraphView.grid property, only line grid is supported (see Qan.LineGrid component, Qan.PointGrid has been deprecated in 0.15.0), default grid is drawn with orthogonal lines.
import QuickQanava 2.0 as Qan
import "qrc:/QuickQanava" as Qan
Qan.GraphView {
id: graphView
anchors.fill: parent
graph: Qan.Graph {
gridThickColor: "lightgrey"
grid: Qan.LineGrid{
gridScale: 50
gridMajor: 5
}
} // Qan.Graph: graph
} // Qan.GraphView
Grid appearance is configurable using the following abstract interface working for both points and lines grids:
gridScale: Interval in points between lines or points.gridMajor: Number of thicks between major points or lines (for example for lines, settinggridMajorto 5.0 means that a major strong line will be drawn every 5 grid tiles).gridWidth: size in points, either grid points or line width.thickColor: Color for points or lines.
| Qan.PointGrid (deprecated) | Qan.LineGrid |
|---|---|
 |
 |